Community Carbon Footprints and how to reduce them
Use our Community Level Carbon Footprint Map to find out the carbon emissions from Decarbonization Zones around Ireland.
Click on a marker on the map to find out more about each community.
Follow their work and get some great ideas from them.
See how the climateconnected tools can help you match what they have done
IMPORTANT NOTE:
You will notice that the CO2eq per person emissionsthis is how much carbon dioxide - and other greenhouse gases - are created by each person in the community - you can see how the numbers are worked out below are, on the whole, higher for rural communities (those in the countryside) than urban communities.
There are a number of reasons for this:
Urban homes and businesses (in cities and big towns) often are on the natural gas grid. Natural gas produces less CO2 than oil or solid fuels, so heating in towns can create less CO2.
In towns and cities, it is easier to get places by public transport, so you don’t have to drive as much – driving can make more CO2 than taking a bus or train the same distance.
Sometimes, how land is used can produce or reduce CO2, so small communities with a lot of land around them can sometimes have more CO2 per person than a closely packed community in a town in a smaller space.
In the map, the rural communities have their CO2eq/pp marked in BLUE
Use the dropdown menu below to filter the map icons by category
What is this map for?
This is not a CO2 ‘league table’. It’s so that you can look at communities that are like yours and see what can be done to make a sustainable impact
Irish Decarbonization Zones
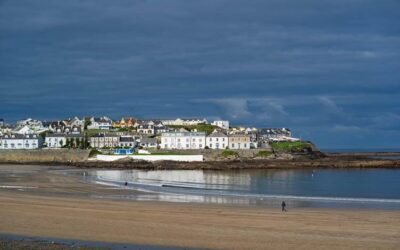
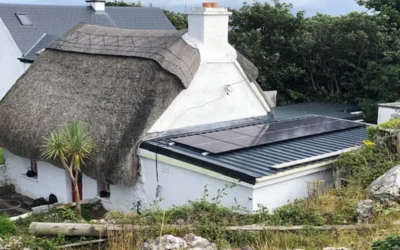
Kilkee and Loop Head DZ
The Loop Head Peninsula has been designated as a Decarbonising Zone (DZ) by Clare County Council. Home to just under 2,900 people, the DZ spans the three westernmost parishes of County Clare: Kilballyowen, Carrigaholt, and Kilkee.
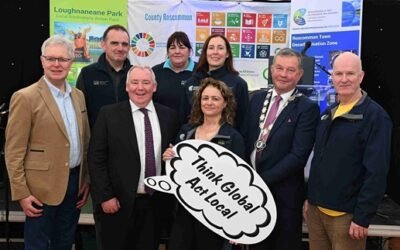
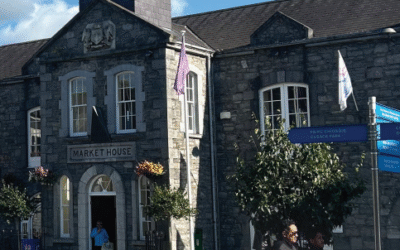
Roscommon Town Decarbonising Zone (DZ)
Roscommon County Council has designated Roscommon Town as the Decarbonising Zone (DZ) for the county — recognising its role as the county’s central hub with its mix of public, commercial and residential functions, and its suitability as a test‑bed for climate‑action initiatives adapted to a rural/mid‑sized town context.
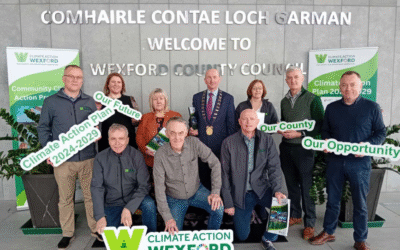
Enniscorthy DZ – Wexford
Enniscorthy Town has been designated by Wexford County Council as the Decarbonising Zone for County Wexford. Wexford County Council’s Climate Action Team is working with various stakeholders, including community groups and voluntary groups, local businesses and industry, schools, and the library, and many more, to deliver decarbonization actions and fulfil the vision for the Enniscorthy DZ.
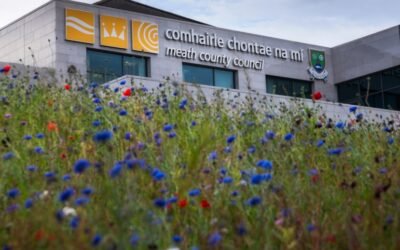
County Meath’s Decarbonization Zones (DZs)
Meath County Council has designated 9 Decarbonising Zones (DZs) across the county, as part of its broader Climate Action Plan. This structure allows the council to take a county-wide, coordinated approach, which places particular emphasis on the nine designated DZ’s, while recognising that each DZ has unique challenges — for example, Bettystown, a coastal town, faces different issues than the inland town of Kells.
Aran Islands DZ (Ceantar Dhícharbónú na hOileáin Árainn)
Galway County Council identified na hOileáin Árann as their decarbonization zone. It is made up by three islands at the mouth of Galway Bay, off the west coast of Ireland, with a total area around 46 km2. From west to east, the islands are Árainn (Inis Mór), which is the largest; Inis Meáin, the second largest; and Inis Oírr. There is a population of 1,347 (as of 2022) and the area is designated as an official Gaeltacht.
Mullingar DZ (Decarbonization Zone) Westmeath
Westmeath County Council has named Mullingar Town as the County’s official ‘Decarbonisation’Zone (DZ) Zone (DZ). According to the Westmeath Climate Action Plan 2024–2029, the Mullingar DZ will focus on both climate change mitigation and adaptation , with a strong focus on protecting and improving local biodiversity.
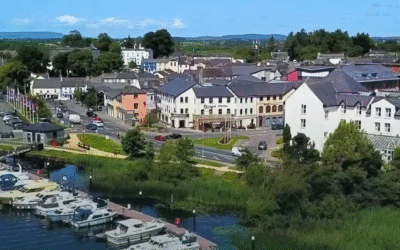
Carrick-on-Shannon DZ
Carrick-on-Shannon is the designated ‘Decarbonisation’Zone (DZ) for County Leitrim. Its vision is that it “…will be a focus for sustainable place-based climate action opportunities — including mitigation, adaptation and biodiversity enhancement — to deliver on the National Climate Objective at local and community levels, and to provide a testbed of learning that can be replicated across County Leitrim.”
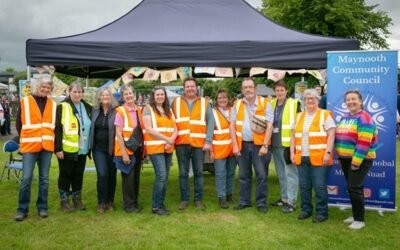
Maynooth DZ, Kildare
Kildare County Council has designated Maynooth Town as the Decarbonising Zone (DZ) for the county. Acting as a “testbed” Maynooth Town will pioneer ambitious climate actions intended to be replicated by other “Fast Follower” towns across Kildare.
Longford DZ (Decarbonization Zone)
Longford County Council has designated Longford Town as its official Decarbonising Zone (DZ).
The vision for Longford Town aims:
“To set an example for County Longford by forging and strengthening engagement between Longford County Council, business, communities, key stakeholders from the private sector, energy network operators and others by striving together towards the National Climate Action Target”.